

On 29 December 2020 (11:19:54 UTC), a Mw 6.4 earthquake struck the central Croatia, close to the town of Petrinja, killing seven people, injuring hundreds, and causing widespread damage. This is the largest earthquake occurred in Croatia since the advent of modern seismometers.
This event nucleated along a right-lateral strike-slip fault, known in literature as Petrinja fault, and was preceded by two earthquakes of magnitude 4.7 and 5.2, which occurred on 28 December. In the following hours and days, there were also numerous aftershocks that reached a maximum magnitude of 4.8.
By using the Differential Synthetic Aperture Radar Interferometry (DInSAR) technique, a team of researchers at the Institute for Electromagnetic Sensing of the Environment of the National Research Council of Naples (IREA-CNR) has studied the surface deformation field induced by the considered seismic event. In particular, the data employed to generate the co-seismic interferograms were acquired by the European satellite Sentinel-1 on 18 and 30 December 2020 and on 23 December 2020 and on 4 January 2021 along ascending and descending orbits, respectively (Figure 1a and 1b). Each fringe corresponds to a LOS-displacement of about 2.8 cm, with a maximum deformation of about 40 centimeters.
Starting from these interferograms, the corresponding deformation maps were then derived (Figure 1c and 1d) through appropriate phase unwrapping procedures. In particular, the ascending track (Figure 1c) presents a deformation pattern characterized by LOS negative values down to about −32 cm and LOS positive values up to about 38 cm, indicating a sensor-to-target distance increase and decrease, respectively; moreover, the descending track (Figure 1d) shows a deformation pattern characterized by both negative LOS displacement values down to about −16 cm and positive LOS displacement values up to about 29 cm.
The availability of both ascending and descending SAR dataset and their consequent combination allow to discriminate the vertical and east–west components of the displacement. In particular, the vertical displacement map shows (Figure 1e) an area affected by a maximum subsidence of -13 cm and an uplifted one with maximum values of 19 cm; moreover, the horizontal displacement map shows a maximum displacement of 43 cm to the west and 42 cm to the east.
The activity has been conducted as part of the 2019-2021 CNR-IREA and DPC (Department of Civil Protection) agreement, the EPOS (European Plate Observing System) project, and I-AMICA (High Technological Infrastructure for Integrated Monitoring of Climate and Environment) project, which is funded by MIUR under the National Operative Programme (PON). The Sentinel-1 data have been provided through the Copernicus Program of the European Union.
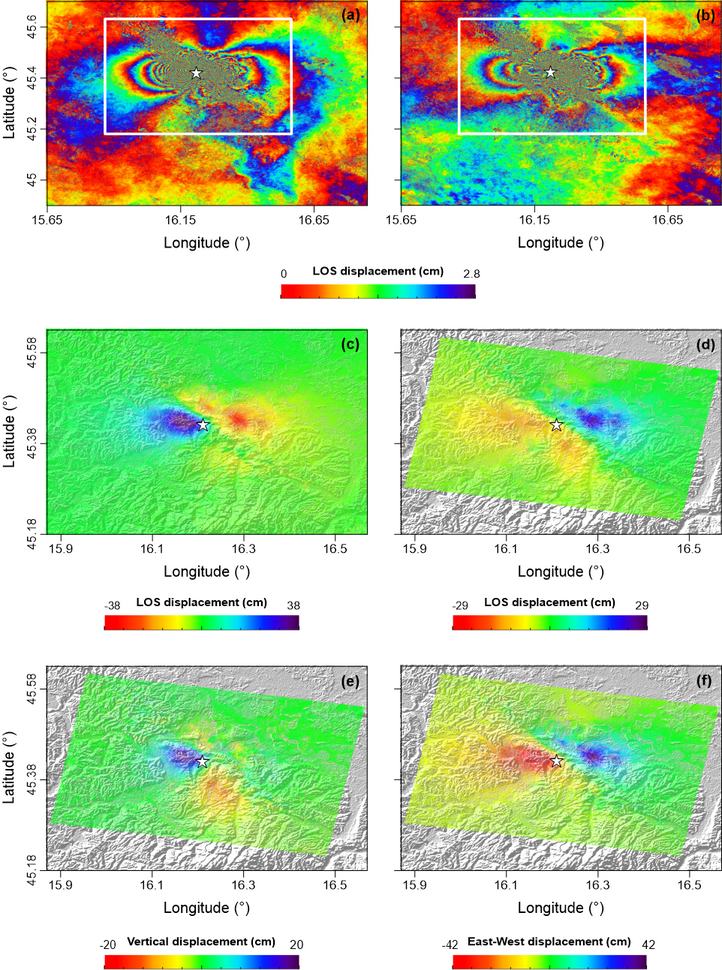
Figure 1. a) Sentinel-1 interferogram relevant to the 18122020-30122020 ascending pair (Track 146). b) Sentinel-1 interferogram relevant to the 23122020-04012021 descending pair (Track 124). The white rectangle represents the area shown in the following panels. c) Line-of-sight (LOS) displacement map computed from the Sentinel-1 interferogram of Figure 1a. d) LOS displacement map computed from the Sentinel-1 interferogram of Figure 1b. (e) Vertical and (f) East-West ground displacements maps. The white star indicates the location of the Mw 6.4 earthquake epicenter occurred on 29 December 2020.