
Maria Consiglia Rasulo

Wildfires records for 2017 summer season indicate that Italy, in Europe, had the highest number of fire events, while in terms of forest area burned, Portugal was the most affected country, where sadly this year’s fires have caused the loss of 40 people.
In the frame of the conference "Protecting the forests from the fires: proposals and actions for the preservation and recovery of the territory. Case Study: Vesuvius "(Naples, October 16, 2017), organized by the General Command of Carabinieri, Dr. Bruno Petrucci of the Directorate General for the Protection of Nature and Sea (DGPNM) of the Ministry of the Environment and Territorial Protection and the Sea (MATTM) held an invited presentation with the contribution of the work done by CNR-IREA researchers.
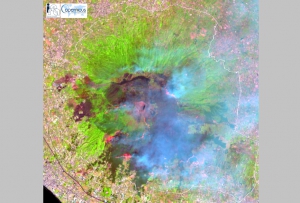
In particular, CNR-IREA has been responsible for processing Copernicus Sentinel-2 satellite imagery to detect areas affected by wildfires that hit the Vesuvius National Park during the 2017 summer season. Images of Figure 2 show the effects of the wildfire on the vegetation cover within the National Park area.

Figure 2 – Vesuvius National Park: comparison between images acquired by ESA Sentinel 2A satellite (natural colors RGB: 432 red, green, blue with 10 m ground spatial resolution) before and after the major fire events of summer 2017. (a) data acquired on May 18, 2017; (b) data acquired on August 26, 2017. Sentinel 2 data are Copernicus copyright (2017). National Park Perimeter (DGPNM / MATTM).
Figure 3 shows maps of fire affected areas produced by processing Sentinel 2A and Sentinel 2B satellite data acquired by ESA. Each color represents the date when the area was first detected as burned. The automatic mapping algorithm is based on the fuzzy integration of spectral indices, e.g. binary combinations of S2 spectral bands (Stroppiana et al., 2012; http://dx.doi.org/10.1016/j.isprsjprs.2012.03.001). The algorithm was applied exclusively to "natural vegetation areas" extracted from the Corine Land Cover map (2012) and within the boundaries of the Vesuvius National Park (DGPNM / MATTM).
IREA researchers are committed to developing new methodologies for the integrated use of optical and SAR data made available by the ESA Sentinel constellations for better characterization of the effects of wildfires on forested areas.

Figure 3 - Vesuvius National Park: Burned area maps derived from ESA Sentinel 2A and 2B images acquired during 2017 summer season. Sentinel 2 data are Copernicus copyright (2017). National Park Perimeter (DGPNM / MATTM).
The study of The Earth's deformations and seismic sources continues, focusing on the events of October 26. This activity is coordinated by the Department of Civil Protection (DPC) and is carried out by a team of researchers from the Institute for Electromagnetic Sensing of the Environment of the National Research Council (CNR-IREA of Naples) and the National Institute of Geophysics and Vulcanology (INGV), centers of competence in satellite radar data processing and seismology, with the support of the Italian Space Agency (ASI).
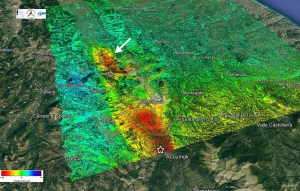
"Using the data from the Japanese satellite ALOS 2, the team of CNR-IREA and INGV researchers measured also on this occasion and with high precision, the permanent ground movements originated during the earthquake by using differential interferometry," explains the director of CNR-IREA Riccardo Lanari. "In this case, the bandwidth used (L band) from the radar operating on board the ALOS 2 satellite allowed us to detect the ground deformations despite the affected area was particularly covered by vegetation. These deformations occur about 8 kilometers further north than those caused by Amatrice's earthquake on August 24, and characterize an area that extends about 20 km northward and have a maximum subsidence of about 18 cm (corresponding to 22 centimeters away, compared to the radar line of sight) at the Vallestretta area".

“Ground movements, along with other geological and seismological data, are now undergoing analysis to elaborate physical-mathematical models through which it will be possible to identify the fault responsible for the earthquake and characterize its profound activity. The first results seem to indicate that the fault activated on October 26 is part of the same geological structure that caused the earthquake of Amatrice. The fault plane, therefore, is inclined to the west about 50 °, lies between 10 and 3 kilometers in depth and does not reach the surface," explains Stefano Salvi of INGV. "Starting from the Colfiorito sequence in 1997, radar satellite data have been used many times in Italy to detect seismic and volcanic sources, thanks also to the techniques developed by CNR-IREA researchers, who are now at the international forefront."
The purpose of the Civil Protection Department, during a seismic emergency, is to quickly obtain a picture of ground deformations and displacements caused by the earthquake in the epicenter area. The CNR-IREA and INGV Competence Centers, thanks to their specific skills, support the Department in the use of satellite data and information and their integration with in situ data. This collaboration enables the development of products, methods, and procedures that improve the national emergency response system and are available to the entire National Civil Protection Service.

 The National Directory of Territorial Data has reported EDI software as a new tool for all Public Administrations committed to enhancing their territorial data heritage.
EDI, developed by IREA-CNR under the RITMARE project, responds in particular to the challenges of quality and coherence of geographic information by giving a variety of modules that guide users to creating metadata in a simple and effective way.
The EDI editor is currently available online and allows a standard compilation according to Italian law (RNDT), but also complying with European and international specifications (INSPIRE and SensorML), thus meeting the needs of different users. Groups, projects or research institutes, but also technicians working in Public Administrations, can take advantage from the product by benefiting from some features that make data management less burdensome.
The software, licensed under Free Open Source (FOSS) GNU GPL v3, is fully customizable. Aspects that were recognized by EDI in the RNDT portal, today a public register of national territorial information certified and available precisely thanks to its metadata.
For more information and technical details of the instrument refer to the paper: Pavesi, F., A. Basoni, C. Fugazza, S. Menegon, A. Oggioni, M. Pepe, P. Tagliolato, and P. Carrara. “EDI – A Template-Driven Metadata Editor for Research Data.” Journal of Open Research Software - JORS 4 (October 25, 2016). doi: 10.5334/jors.106.

 During the World Congress of the International Fuzzy Systems Association (IFSA) held from June 27 to 30 in Otsu, Gloria Bordogna, Senior Researcher at IREA, was awarded the IFSA Fellow grade. The title, reserved reserved for distinguished contributors whose works have had a significant impact on fuzzy logic theory and applications, was handed during the European Society for Fuzzy Logic and Technology (EUSFLAT) conference, held in Warsaw on 11-15 September 2017.
Gloria Bordogna has been working for many years in the field of application of Fuzzy Set theory to enable modeling of uncertainty and imprecision in information retrieval systems, databases, and geographic information systems for the representation of textual content, flexible querying, analysis of textual and geographic information on the Web and in social networks.
Immediately after the Ischia earthquake of 21 August 2017, researchers at CNR-IREA measured the Earth surface displacements thanks to the data acquired by the European Sentinel-1 and Italian COSMO-SkyMed constellations of satellites. A subsidence up to 4 centimetres was measured close to Casamicciola Terme.
During the post-event phase, the Department of Civil Protection (DPC) activated the National Research Council - Institute for the Electromagnetic Sensing of the Environment (CNR-IREA) of Naples, as Centre of Competence in the radar data processing, to analyse and measure the Earth surface displacements induced by the earthquake.
By exploiting the radar data acquired by the European Sentinel-1 satellites of the Copernicus programme, as well as those of the Italian COSMO-SkyMed (CSK) constellation - owned by the Italian Space Agency (ASI), Centre of Competence for the acquisition and use of satellite data, and the Italian Ministry of Defence - a team of researchers at CNR-IREA measured the earthquake-induced ground displacements by exploiting the Differential SAR Interferometry (DInSAR) technique. Such a technique allows measuring, by using radar images acquired before and after an event, the ground displacement along the sensor Line of Sight (LOS) occurred in the interval between the two acquisitions with centimetre accuracy. Moreover, thanks to the satellite ascending and descending passes it is possible to compute the Vertical component of the deformation field.
Table 1 lists the interferometric pairs shown in the following Figure 1; note that the list of Table 1 represents only a portion of the interferograms effectively generated by CNR-IREA
Table 1: Co-seismic interferometric pairs relevant to the Ischia earthquake
|
Sensor |
Interometric Pair |
Wavelength [cm] |
Perpendicular Baseline [m] |
Orbit Pass |
|
S1 |
16082017 – 22082017 |
5.5 |
7 |
DISC |
|
S1 |
16082017 – 22082017 |
5.5 |
55 |
ASC |
|
S1 |
17082017 – 23082017 |
5.5 |
108 |
ASC |
|
CSK |
19082017 – 23082017 |
3.1 |
67 |
DISC |
Figure 1 shows the co-seismic displacement maps in LOS obtained from the S1 and CSK data pairs reported in Table 1 and computed in correspondence to the pixels characterized by a high quality of the interferometric signal (the so called coherent pixels). Although several atmospheric artefacts are clearly present, it is evident a region of increased range change (represented in red) around 1 km South-West of Casamicciola Terme.
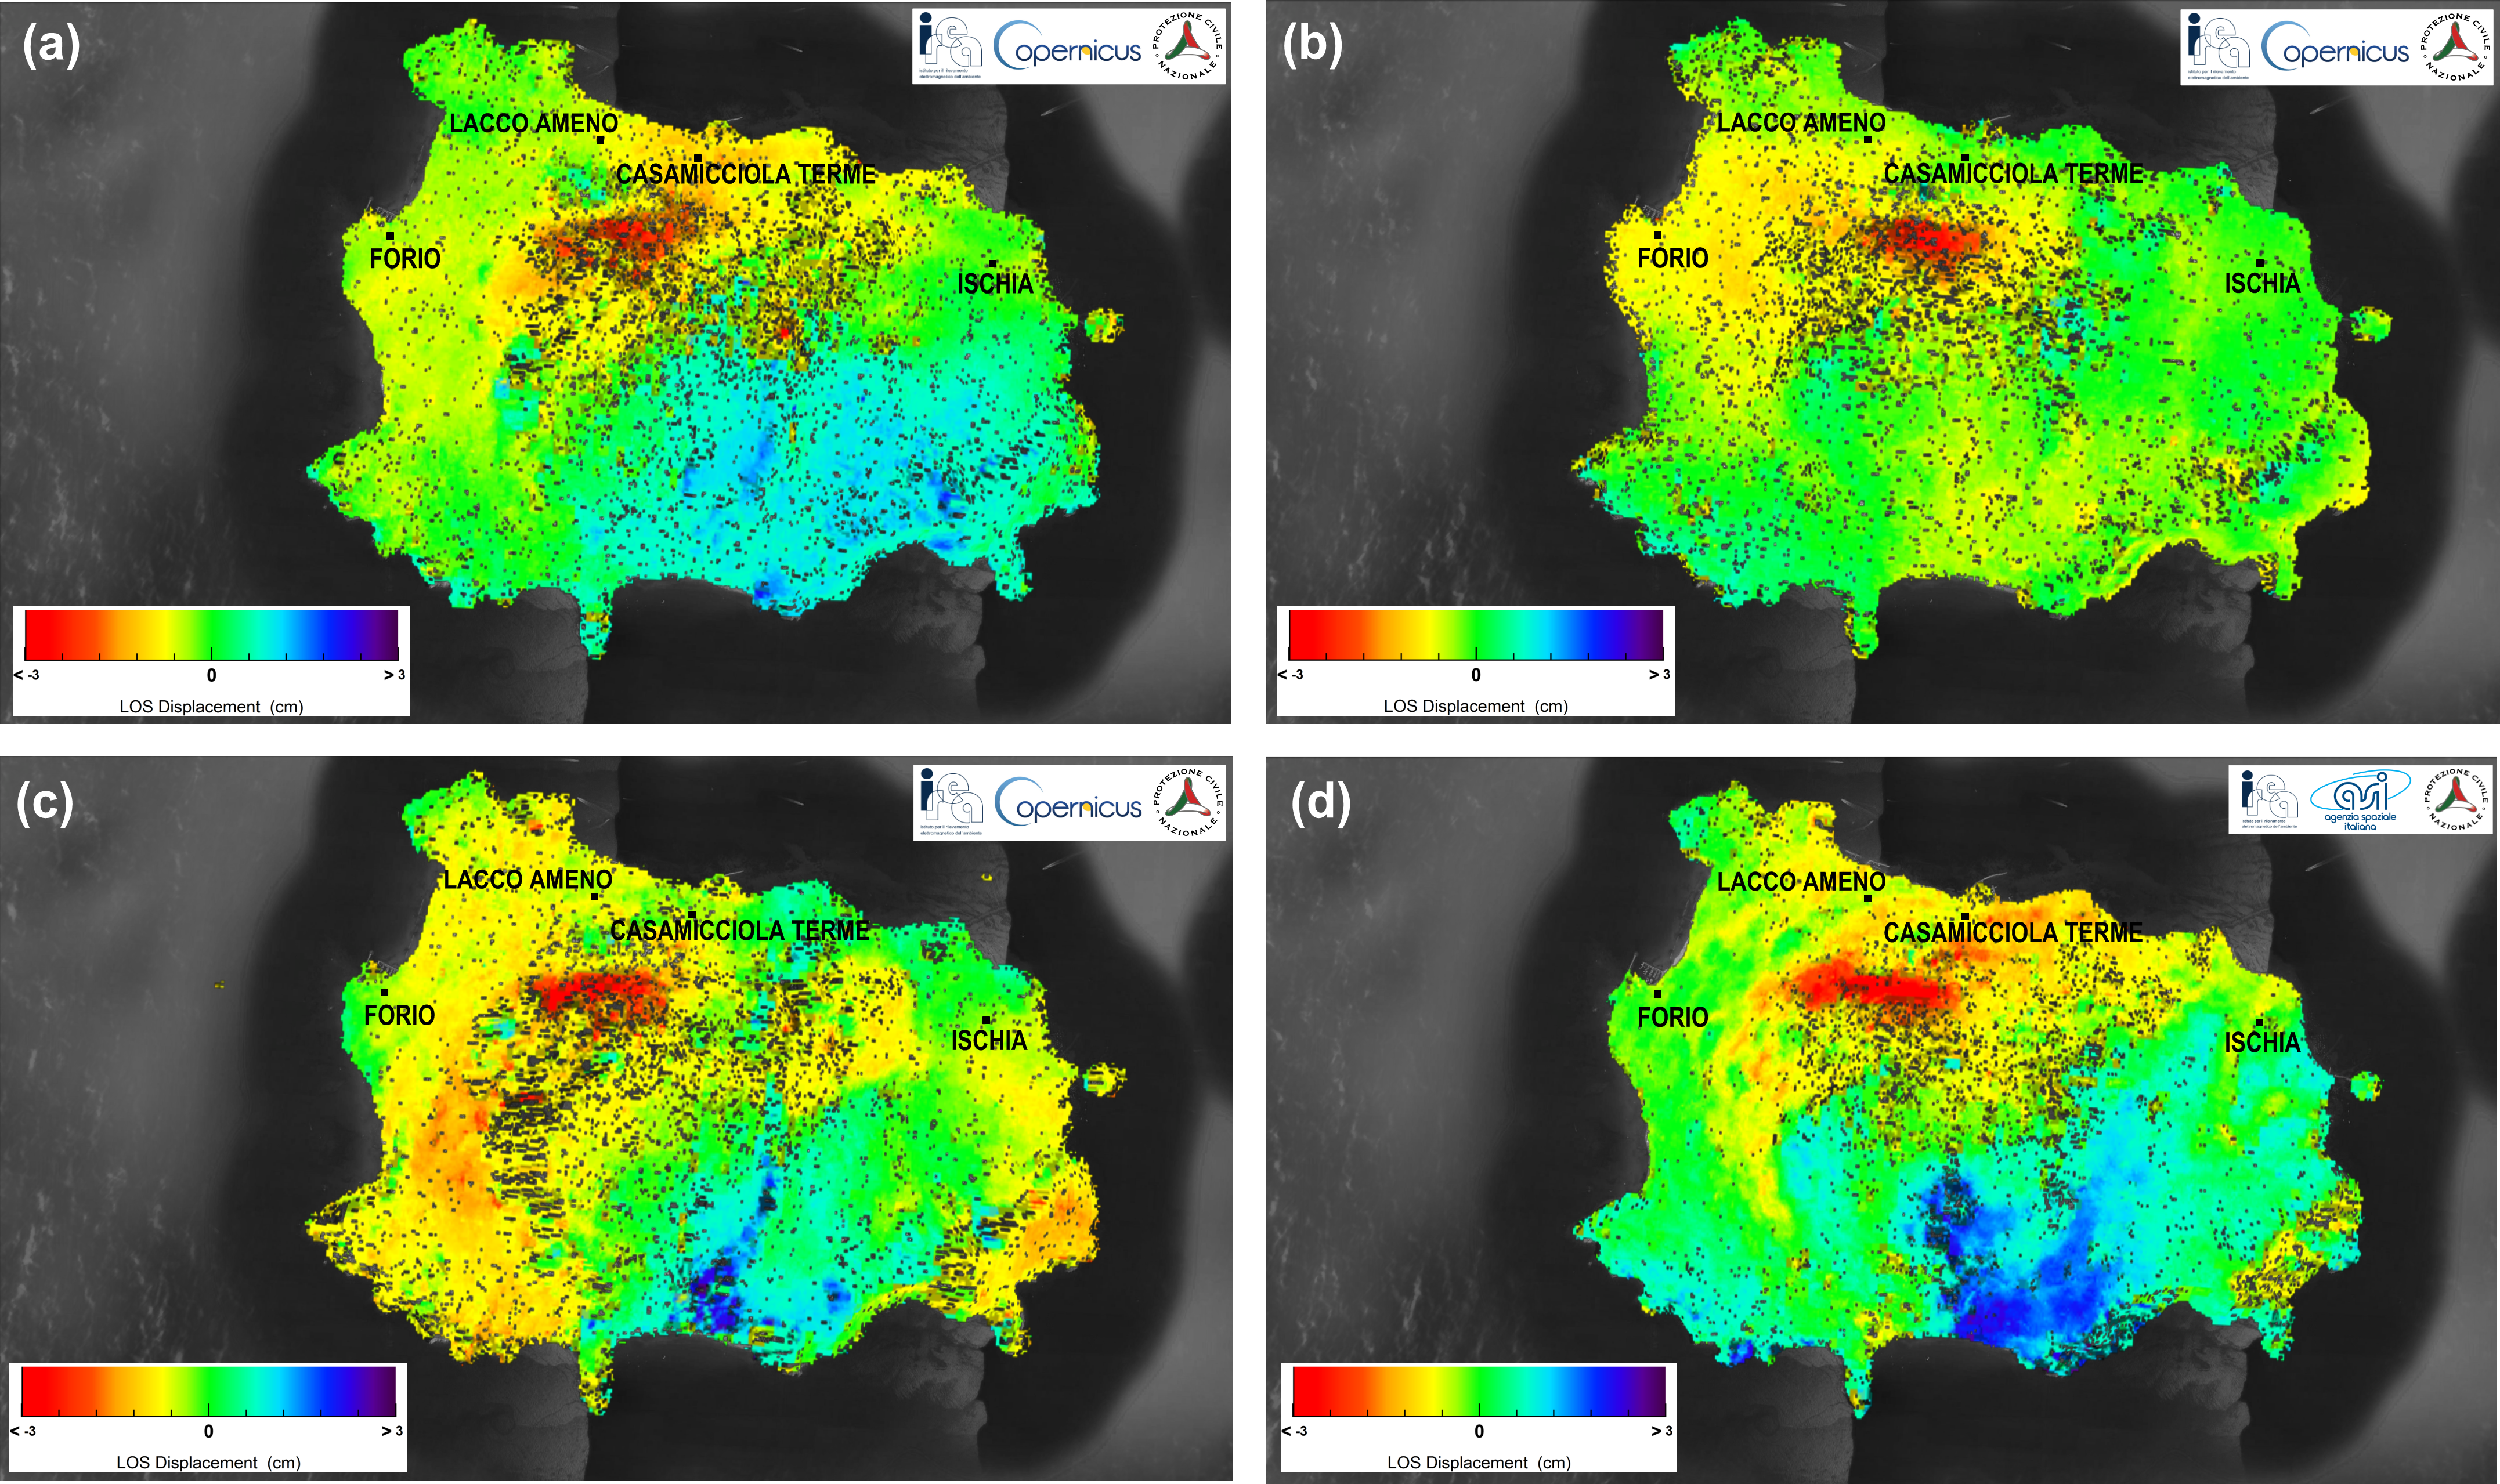
Figure 1 – Displacement maps (in LOS) obtained from Sentinel-1 (S1) and COSMO-SkyMed (CSK) SAR data: (a) map relevant to the 16082017– 22082017 S1 ascending pair; (b) map relevant to the 16082017–22082017 S1 descending pair; (c) map relevant to the 17082017– 23082017 S1 ascending pair; (d) map relevant to the 19082017– 23082017 CSK ascending pair. Contains modified Copernicus data (© 2017). CSK data are copyright of ASI (2017).
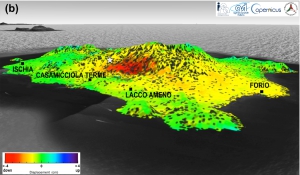
By jointly exploiting the ascending (i.e., the satellite flew from South to North) and descending (the satellite flew from North to South) displacement maps shown in Figure 1, CNR-IREA researchers computed the Vertical component of the ground displacements. Such a map is presented in Figure 2, in both a planar and 3D views. In particular, it was detected a subsidence up to 4 centimetres in a region (in red) close to Casamicciola Terme, the area most affected by building damages.
Such results have been shared with the Istituto Nazionale di Geofisica e Vulcanologia (INGV), in a framework of fruitful cooperation. Moreover, detected displacements are consistent with the earthquake location of INGV (updated on 25 August 2017).
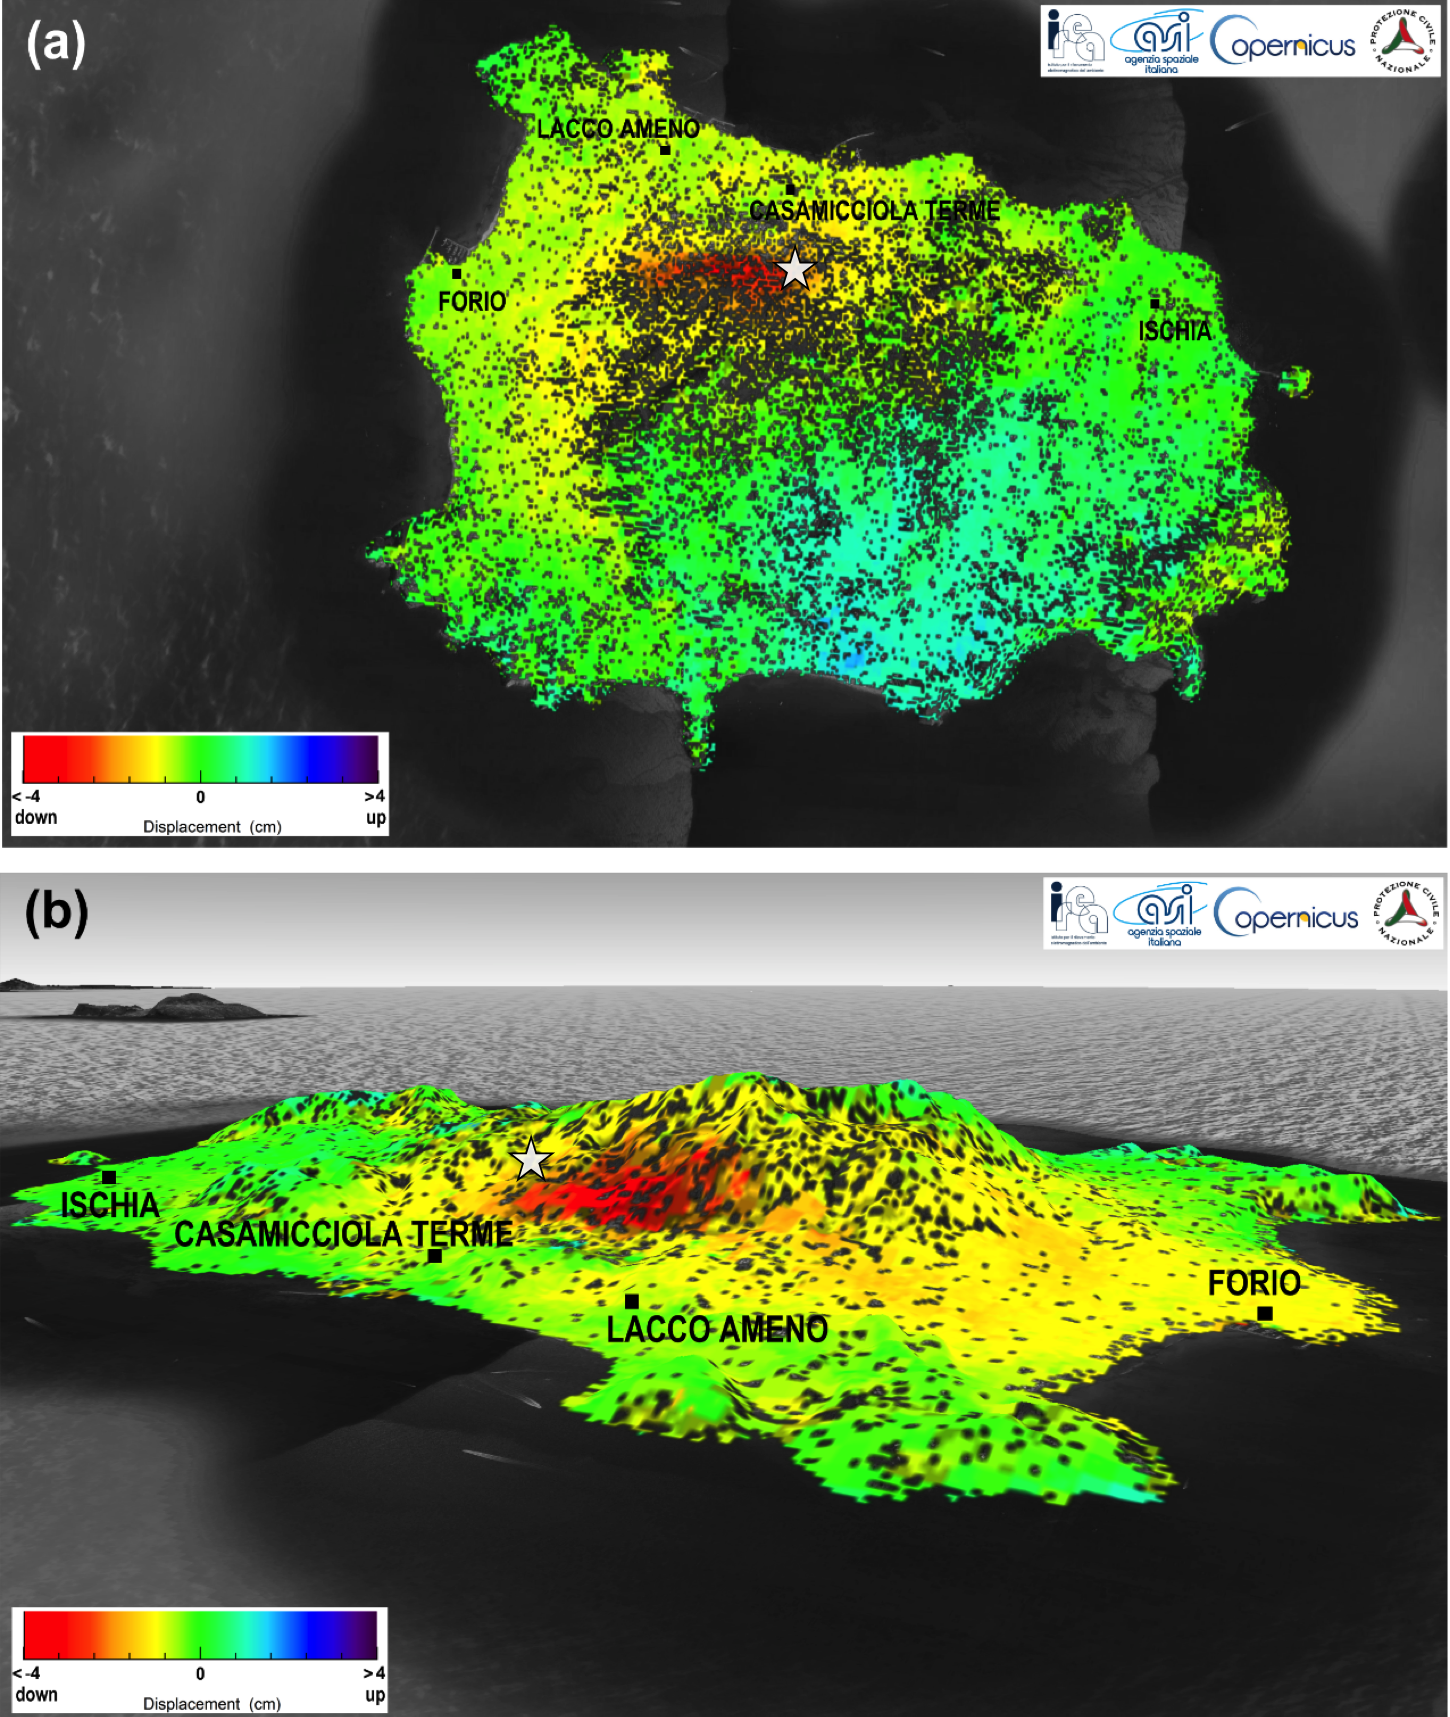
Figure 2 – Vertical component of the ground displacements computed from the maps of Figure 1: a) planar view; b) 3D view. The white star indicates the location of the epicentre according to INGV (updated on 25 August 2017). Contains modified Copernicus data (© 2017). CSK data are copyright of ASI (2017).
To obtain a synoptic picture of the ground displacements induced by an earthquake close to the epicentre area in very short time represents one of the objectives of the Italian DPC during a seismic crisis. The obtained results came out after a long cooperation between the DPC and their Centre of Competences – in this specific case CNR-IREA and ASI. On the basis of their expertise, such Competence Centres support the DPC in the use of satellite data and related value added information, as well as in their integration with the in situ data provided by others Competence Centres. This activity allowed developing products, methods and procedures that improved the capabilities of the National Service of the Civil Protection during emergency phases.


IREA, together with the Institute of Applied Physics at Carrara (IFAC-CNR) and the Italian Society of Optics and Photonics (SIOF), is organizing in Naples the XIV edition of Europt(r)ode, one of the most important Conferences worldwide in the field of optical sensors for chemical and biological applications.
Submission of contributions is open. For more information visit the Europt(r)ode XIV website

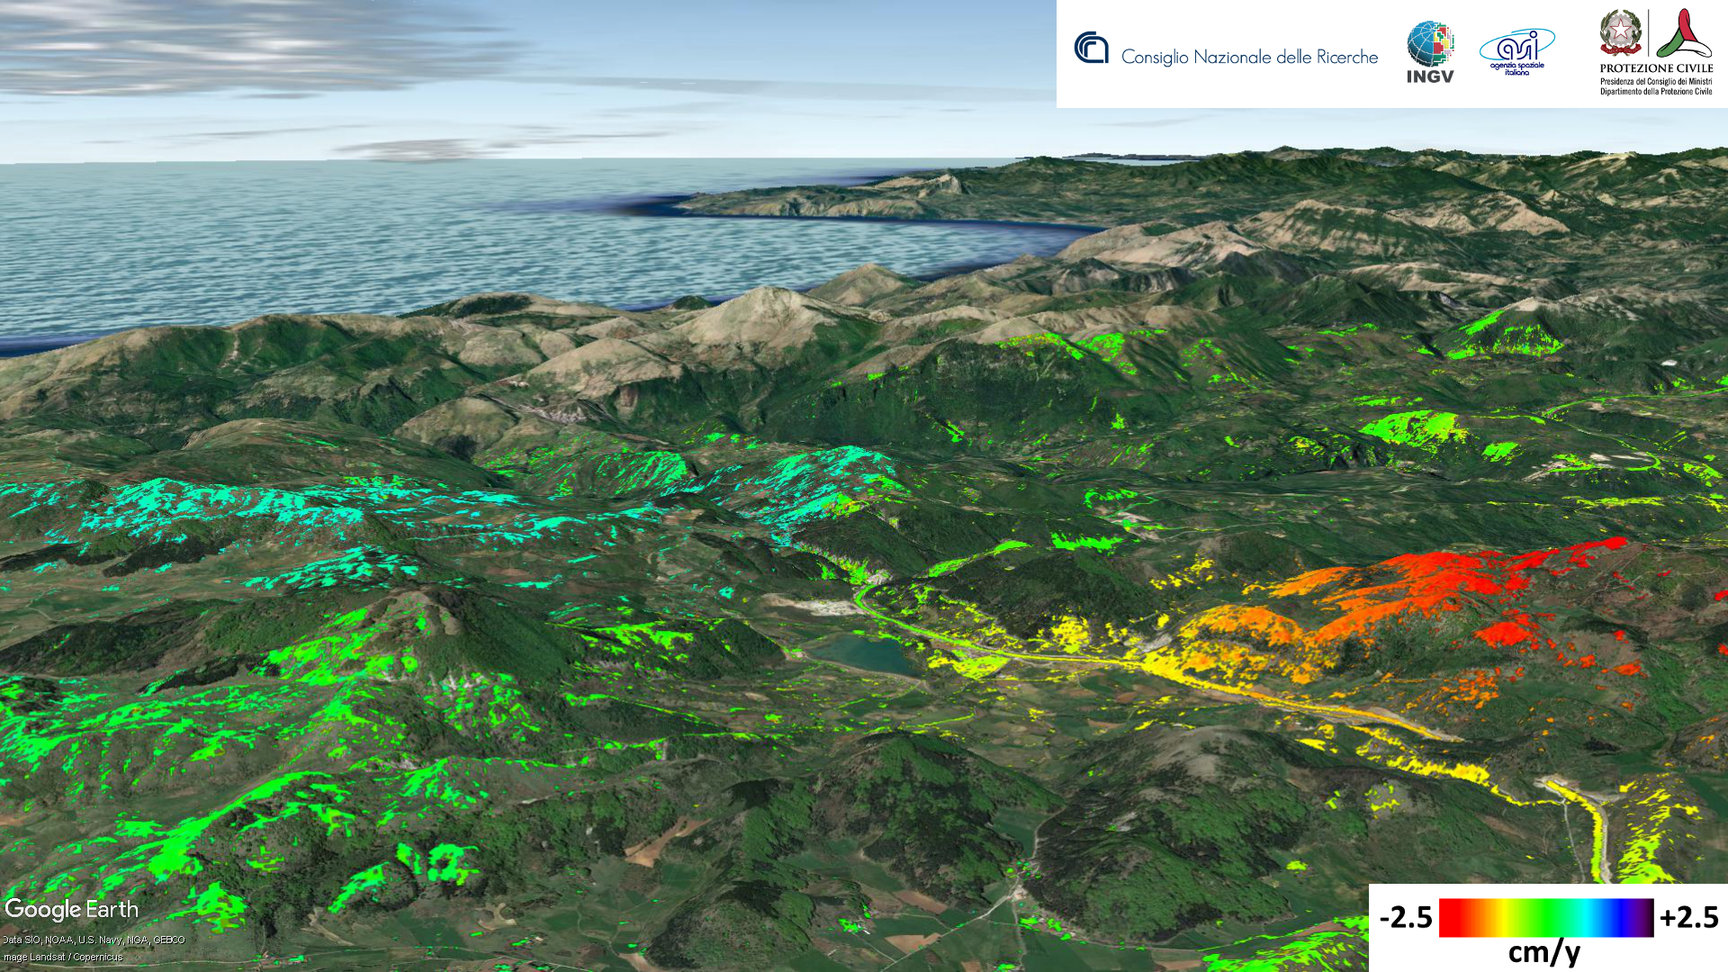
Revealed, for the first time in Italy, in the Pollino area, the presence of slow fault movements during a sequence of low magnitude earthquakes, which help to explain why in this area, compared to the rest of the Apennines, the earthquakes of higher magnitude are less frequent. The study was published in "Scientific Reports".
During the long seismic sequence which affected the Pollino area (Italy) from 2010 to 2014, there were not only earthquakes but also a slow and continuous slip of faults, without any seismic activity. This has been pointed out the first time in Italy by a research just published in "Scientific Reports" by a team of researchers from the Institute of Geophysics and Volcanology (INGV), the Institute for Electromagnetic Sensing of the Environment of the National Research Council (IREA -CNR), in collaboration with the Civil Protection Department. The findings of the study shed new light on the seismicity in historical times in the Pollino area.
"In recent years," says Daniele Cheloni, Researcher at INGV and first author of the work, "it was noted that low magnitude seismic sequences are often accompanied by aseismic slip, although the lack of a sufficient number of ground deformation measurements during these sequences has prevented, so far, the proof of such hypothesis in the Italian area".
Earthquakes, as known, are caused by movements of faults, i.e., crustal fractures, which occur very quickly (within seconds). In other cases, the same faults may move slowly (over weeks or months) without generating earthquakes (aseismic slip). To demonstrate the simultaneous presence of seismic activity and aseismic movements, researchers have used the GPS station data (constellation of satellites of the Global Positioning System) of the INGV RING network (http://ring.gm.ingv.it), installed in 2011 as part of an INGV project for the study of the tectonic deformation in the Pollino area, and radar images collected from the COSMO-SkyMed satellite of the Italian Space Agency (ASI), provided as part of the ASI Open Call COSMO-SkyMed.
"Available Satellite data," explains Eugenio Sansosti Senior Researcher at IREA-CNR, "provided a high detail, both in space and in time, unimaginable with other sensors, allowing us to measure such subtle and slow ground deformations, like those related to aseismic slip". This was possible also thanks to the intensification of satellite acquisitions in the Pollino area set up by ASI, following a Civil Protection Department advice, during the seismic sequence.
The huge amount of satellite data available requires a precise and complex processing operation. "We used innovative techniques developed at our Institute over past years, to follow the changes over the time of the deformation signal," specifies Gianfranco Fornaro Senior Researcher at IREA-CNR, "and comparison of our results with GPS data did not leave room to any doubt on the reliability of our measurements."
The obtained results are important for the understanding of the seismicity in the Pollino area. Historical records of the last centuries show no evidence of large seismic events that, in fact, affect adjacent areas of the Apennines and Calabria. "The aseismic movement contributes to the release of a part of the tectonic deformation that would be released, otherwise, by earthquakes. This may explain why, compared to the rest of the Apennines, large magnitude earthquakes are relatively less frequent in the Pollino area. Further advances in the understanding of the seismogenic phenomena in the Italian area need observational systems like the RING GPS network, the COSMO-SkyMed mission, and the National Seismic Network," says Nicola D'Agostino, Senior Researcher at INGV and coordinator of the research.
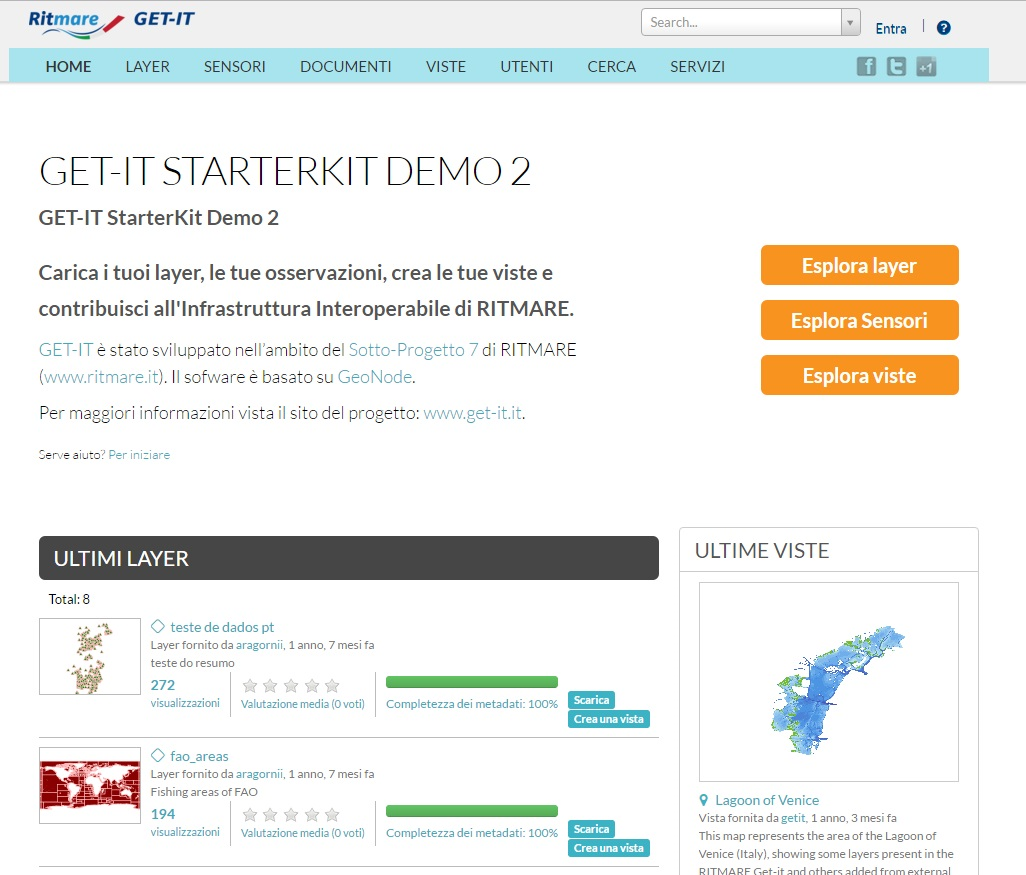
The GET-IT software was recently recognized a useful tool to make the INSPIRE Directive operational. GET-IT is now reviewed and registered in the “INSPIRE in Practice” catalogue. “INSPIRE in Practice” is the official INSPIRE platform dedicated to every user engaged in geographic information domain who would adopt tools contributing to spatial data interoperability among different European countries. “INSPIRE in Practice” is particularly devoted to give visibility to practices and means able to implement the INSPIRE Directive, resulting in an online collaborative framework that fosters the exchange of knowledge and expertise between different users.
GET-IT was developed by CNR-IREA and CNR-ISMAR in the RITMARE research framework in order to enable researchers to manage, share, visualize and download spatial data according to OGC standards. GET-IT allows managing maps, observations and documents by using a single tool resulting in the first open-source collaborative effort toward the integration of traditional geographic information with observational data. GET-IT is a tool that could be easily adopted by a different range of researchers in their working practice, not only to manage different types of spatial data but also to easily compile corresponding metadata. GET-IT includes the EDI metadata editor tool for the guided metadata creation and publication according to INSPIRE standards.
GET-IT is distributed with an open-source license ( GPL v.3.0 ) and through a ready to use virtual machine. More info are available at http://www.get-it.it/
The IREA staff has 83 units, distributed between the headquarters in Napoli and the Secondary Location in Milano, including 43 structured researchers and technologists (10 are temporary researchers), 16 technical and administrative assistants (6 are temporary staff) and 23 unstructured researchers.
Furthermore, 10 associate researchers and many young people in training through scholarships, PhDs, traineeships, and students who carry out their thesis at the Institute, contribute to the research activities.

|
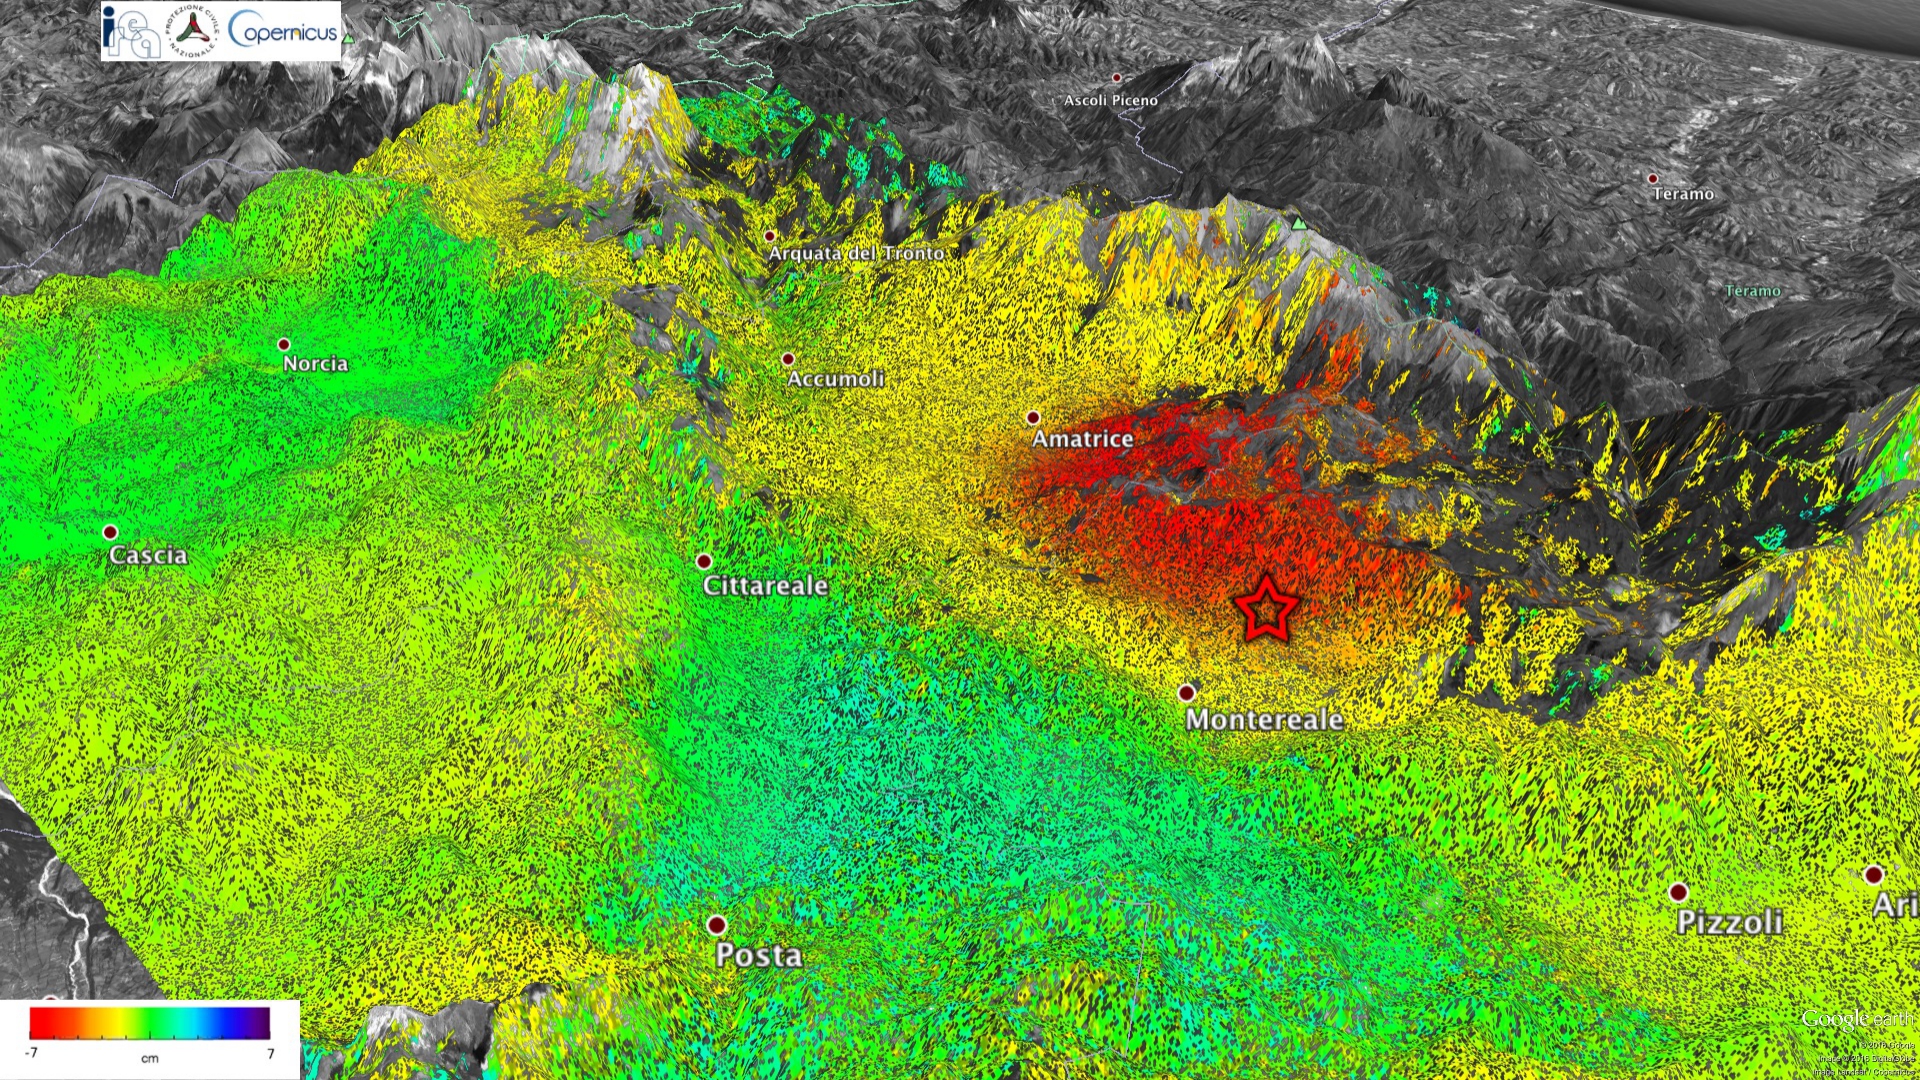
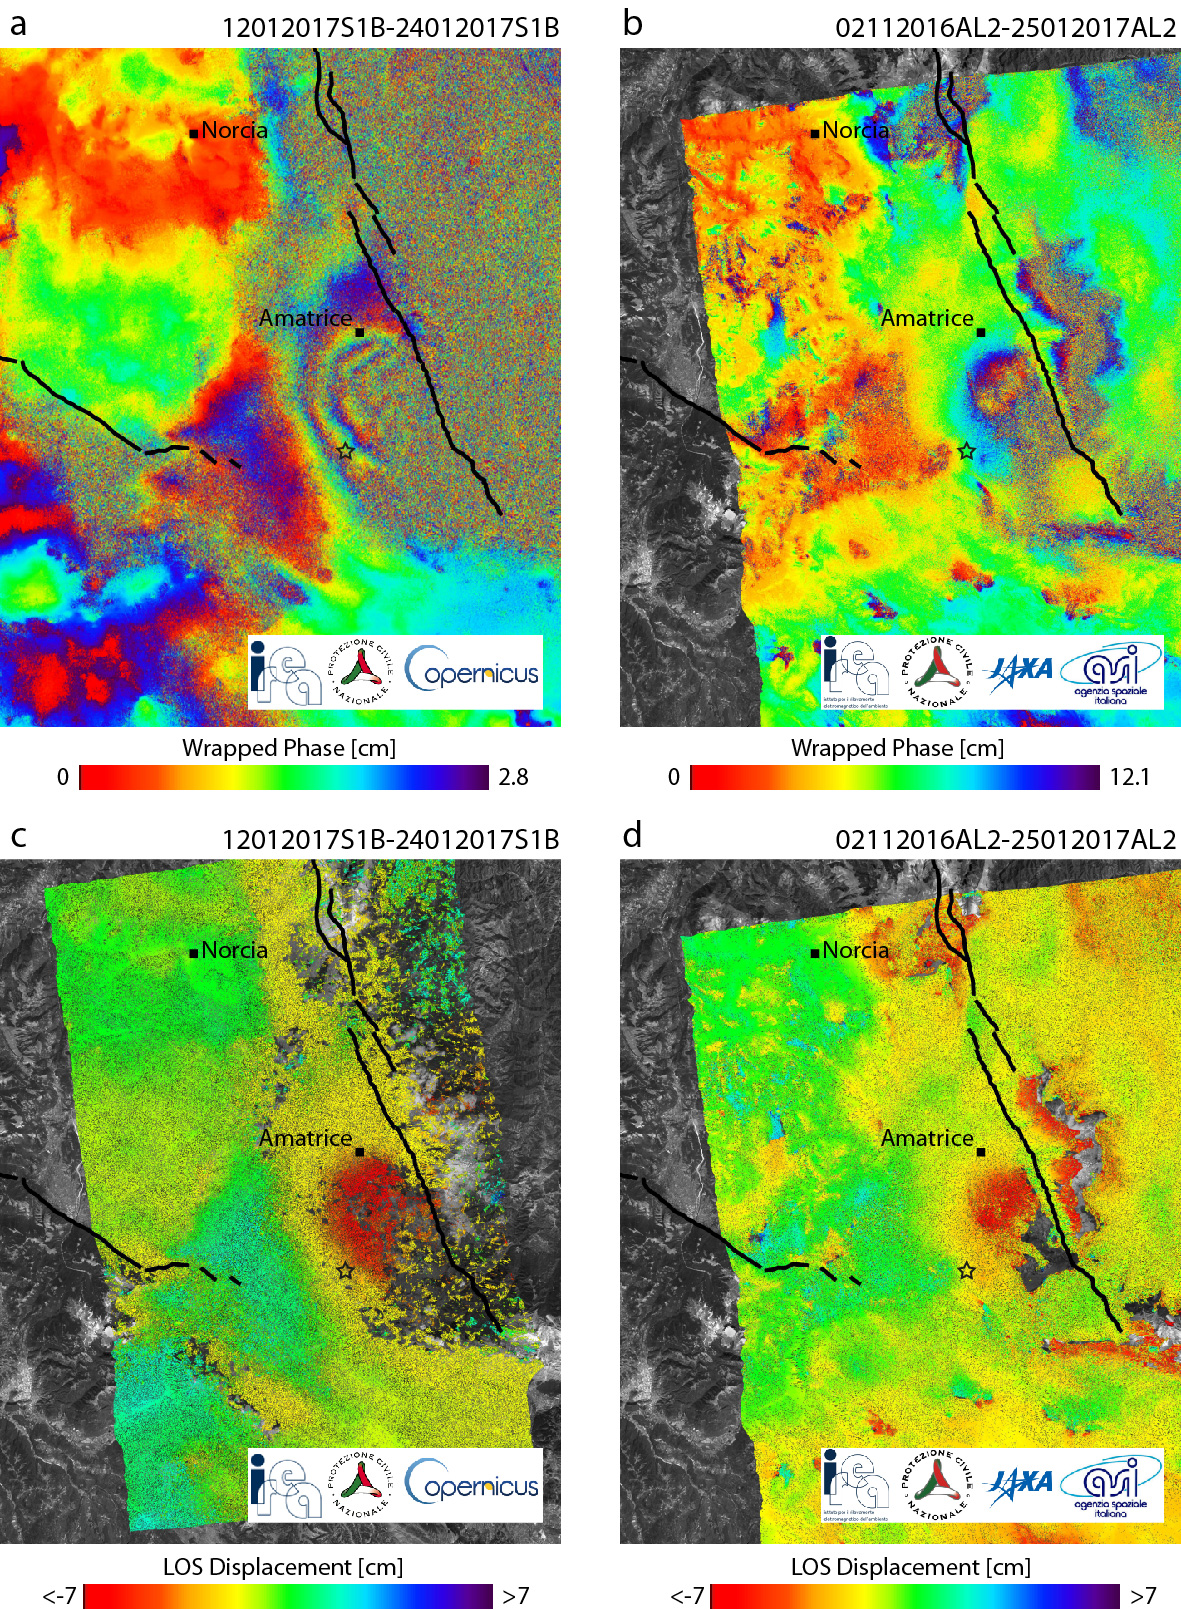
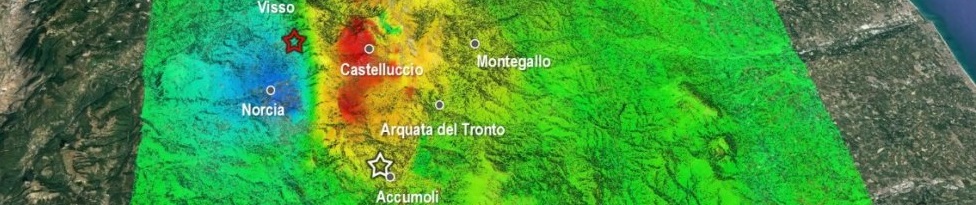
Despite the copious snow cover and the adverse weather conditions, the Sentinel-1 and ALOS-2 satellites allowed a team of IREA-CNR scientists to retrieve the Earth’s surface deformation induced by the recent seismic sequence in central Italy, whose main shock reached a magnitude of Mw 5.5 on 18 January 2017. Thanks to the joint processing of two radar images acquired across the main event by the Sentinel-1 satellite constellation of the European Copernicus program, it was possible to generate the so-called co-seismic Interferogram (see Figure 1a), a map that permits scientists to directly relate the radar signal to the displacement of the ground. Exploiting the ALOS-2 data of the Japanese Space Agency (JAXA), it has also been carried out a similar analysis that confirms the main findings obtained via the Sentinel-1 data (see Figure 1b). Starting from the shown interferograms, the corresponding displacement maps have also been generated. They show (see Figures 1c and 1d) that the Earth surface moved away from the satellite with a maximum of about 10 cm in an area south to Amatrice. A zoom of the area affected by the coseismic deformation (displayed in red) is shown in figure 2. These maps have been subsequently provided to INGV for modeling the causative source of the seismic event. A more detailed analysis is provided here:
The activity is coordinated by the Italian Department of Civil Protection (DPC) and is performed by a research team of the Institute for Electromagnetic Sensing of the Environment of the National Research Council (CNR-IREA in Naples) and the National Institute of Geophysics and Volcanology (INGV), which are centers of competence in the satellite data processing and seismology sectors, respectively, with the support of the Italian Space Agency (ASI). The Copernicus program is led by the European Commission. The European Space Agency is in charge of developing the Sentinel satellites; ESA also operates the two Sentinel-1 satellites. The ALOS-2 data were provided by JAXA in the framework of an agreement with the Italian Space Agency (ASI) for the exchange of data useful to emergency management. The activity has been also supported by the GEP project of the European Space Agency (ESA) and the project "High Technological Infrastructure for Integrated Monitoring of Climate and Environment" (I-AMICA) funded by the Italian Ministry of Education, University, and Research as part of the National Operational Programme (PON).
|
|
Figure 1 – Co-seismic interferograms and displacement maps generated from Sentinel-1 and ALOS-2 data. a) Sentinel-1 interferogram relevant to the 12012017-24012017 ascending pair (Track 117). b) ALOS-2 interferogram relevant to the 02112016-25012017 ascending pair (Track 197). c) Displacement map (in LOS) computed from the Sentinel-1 interferogram of Figure 1a. d) Displacement map (in LOS) computed from the ALSO-2 interferogram of Figure 1b. Black star indicates the location of the Mw 5.5 epicenter of the 18 January 2017. Black lines indicate main regional structures. Contains modified Copernicus data (2017) and ALSO-2 data (©JAXA 2016-2017).
|